Co-authored by Stephen Zemba, PhD, PE
This is the second installment in a series of postings on per- and polyfluoroalkyl substances – PFAS – a class of widely-used human-made chemicals now viewed by many as a threat to human health, and a recent focus of the environmental industry. The first posting discussed the background presence of PFAS in soil, which suggests stable, long-chain compounds are common in soils at low concentrations.
This second segment will discuss PFAS in drinking water, a topic which has garnished much of the regulatory attention (so far) given its contribution to PFAS exposure. Per its recently released roadmap, EPA expects to propose a national primary drinking water regulation for PFOA and PFOS in 2022, as well as establish new drinking water health advisories for additional PFAS.
National awareness of PFAS was stimulated by the U.S. EPA’s 2013-2015 sampling of large public water supplies pursuant to the Unregulated Contaminant Monitoring Rule (UCMR3), which revealed concentrations of PFAS above the 2016 Lifetime Health Advisory (LHA) of 70 parts per trillion (ppt) in some samples. Only six PFAS were sampled, and detects were infrequent, but a 2016 paper1 estimated that the drinking water of 6 million Americans contained PFAS above the newly minted LHA. This figure is overestimated due to (1) the failure to consider blending of water sources, (2) not considering water systems with multiple sources and only one source with a detection, and (3) extrapolation to entire watershed areas. However, UCMR3 did lead to identification of numerous contaminated water supplies – often near military installations that used Aqueous Film Forming Foam (AFFF). It also prompted many water suppliers to sample for PFAS and in some cases install treatment systems or reallocate/blend sources to reduce PFAS concentrations in delivered drinking water. Several states have conducted more thorough surveys of PFAS in drinking water and are finding that, while very few samples still exceed the LHA, PFAS are being detected more frequently thanks to lowering of analytical methods. For example, Pennsylvania’s UCMR3 sampling revealed PFOA or PFOS detections in 2.1% of samples, with 1.6% exceeding the LHA. The state’s recent follow-up survey detected PFOA or PFOS in 36% of samples, though only 0.5% exceeded the LHA. However, 5% of the samples had concentrations greater than the state’s preliminarily proposed Maximum Contaminant Levels (MCLs), which are less than 20 ppt. Costs of treatment and monitoring to meet these standards over 20 years are reported to total $85 million and $75 million for PFOA and PFOS (independently).
The net observations on the PA example are (1) PFAS are present at low levels in a substantial fraction of drinking water supplies, though not commonly at levels that exceed the LHA or even more stringent standards set by some states, (2) treating the public water supply to achieve PFAS standards in the 10-20 part per trillion (ppt) range will be costly, and (3) detectable PFAS may remain in many drinking water systems at low ppt levels if states implement MCLs in the 10-20 ppt range. Will consumers accept detectable PFAS in drinking water? Costs will be substantially greater if we ultimately require no detectable PFAS in drinking water.
PA expects to achieve 90+% improvement in health protection by adopting 18 ppt (PFOS) and 14 ppt (PFOA) MCLs. There is no estimation, however, of the health effects being caused by PFAS presently in drinking water. Evidence points to potential developmental and immunological effects, but reliable, quantitative health risk estimates are not available. Hence, we have no way to know what the public health benefits will be. As a result, most MCLs proposed or established by states contain substantial levels of protection to compensate for uncertainties, assuming that the basis of assumed (but unconfirmed) health effects are valid. As an example, regulatory standards typically consider a term called the Relative Source Contribution (RSC), which represents the fraction of allowable exposure that can result from drinking water, accounting for “background” exposure from other pathways such as dietary intake and inhalation. By default, for emerging contaminants, background exposure is assumed to account for 80% of allowable intake. However, PFAS measurements in human blood and half-life studies can be used to estimate background exposures of the order of 10% or less of target allowable intakes. Thus, the RSC could justifiably be set to 90% rather than the default 20%, which would result in PFAS drinking water standards 4-5 times higher than the 10-20 ppt levels that have been established by a number of states. Review of PFAS occurrence data in public water supplies in the UCMR3 and various focused state studies would indicate that MCLs incorporating a more representative RSC would substantially reduce the number of water systems requiring treatment. Further information on this topic is provided in the comments submitted by Sanborn Head to the Agency of Toxic Substances and Disease Registry, which can be downloaded by request below.
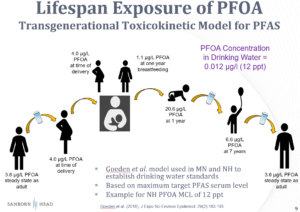
Another trend in setting regulatory standards involves the use of multi-generational exposure models, which predict peak blood PFAS concentrations in infants that receive PFAS from their mothers, both in utero and from breastfeeding. These models incorporate numerous assumptions concerning rates of uptake, storage, and elimination of PFAS by both child and mother. There is once again a tendency to select parameters in a manner that errs on the side of health protection. As an example, the following illustration of the model behind New Hampshire’s PFOA MCL traces PFOA levels in blood at various life stages. The model is designed to limit the peak PFOA level in the child’s blood under the assumption of potential effects on immunologic development at higher exposure levels. A basic check of the model predictions can be made by examining the ratio of the predicted PFAS concentration in the mother’s blood to the PFAS concentration in her drinking water. For this PFOA example, this ratio is more than 300, which is protectively three times higher than typical ratios of 100 observed in empirical data.
There is reason for concern regarding PFAS, and understanding safe levels is critical, as some of these compounds accumulate in our blood, and effects on immune system development, if valid at environmental exposure levels, could lead to greater susceptibility to disease. However, a holistic approach to understanding the potential health benefits and the likely economic costs prior to adopting PFAS MCLs is also important. Since proposed or currently promulgated MCLs will likely cost hundreds of millions or even billions of dollars to implement, funding additional toxicity studies could reduce uncertainties and lead to more cost-effective, science-informed standards. For example, conducting laboratory studies in animals that better mimic PFAS behavior in humans could provide more relevant data, rather than continuing to rely on studies in rats and mice that are bad biological models for PFAS in humans and require highly uncertain adjustments to use as the basis for human toxicity values.
The next blog installment will discuss PFAS in groundwater and surface water quality. A copy of the comments and analysis of PFAS background exposure in the context of setting drinking water standards can be obtained by completing the download request below.
1Assuming a bulk soil density of 1.5 g/cm3 for soil and water density of 1 g/cm3, 1 ppb = 1,000 ng/kg in soil can supply 20 ppt = 20 ng/kg = 20 ng/L in an equivalent depth of groundwater 1,000×1.5÷20 = 75 times.
Posted In: Articles
Tagged In: Industrial, PFAS, Research