Municipal wastewater treatment plants are designed to remove contaminants from their combined influents of sewage, wastewater, and industrial waste streams. Many organic contaminants are degraded by treatment, but metals, polychlorinated biphenyls (PCBs), polychlorinated dibenzo(p)dioxins and furans (PCDD/Fs), and stable per- and polyfluoroalkyl substances (PFAS) do not readily degrade and largely partition to solids. At a typical solids:water ratio of 150 kg/million liters, dry weight concentrations of non-degrading contaminants in biosolids can conceptually be 7,000 times higher on a mass per mass basis than in the incoming wastewater (not accounting for PFAS precursor transformations, which may also increase the concentration of terminal degradants such as perfluorooctanoic acid (PFOA) and perfluorooctane sulfonic acid (PFOS).
The U.S. Environmental Protection Agency (EPA) has long encouraged the reuse of biosolids as fertilizer on agricultural fields and other land applications, and data indicate land application accounted for roughly 60% of biosolids management in 2024 (Figure 1). However, regulatory concern by EPA and States appears to be increasing, with the fate of this common beneficial reuse potentially tied to the fate of PFAS.
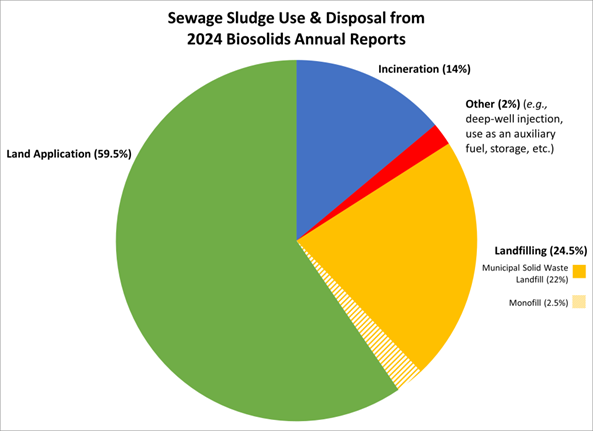
Figure 1 Biosolids management in the United States, 2024. Source: U.S. EPA
EPA uses risk assessment to evaluate the safety of biosolids management options. The Part 503 Subpart C land application concentration limits for heavy metals were established in 1993 based on a detailed risk assessment, and subsequent risk assessments in 1999 focused on incineration primarily of PCBs and PCDD/Fs, finding no need for regulations based on a survey of incinerator emissions.
The draft 2025 PFAS biosolids risk assessment includes only PFOA and PFOS and in structure follows the conceptual exposure scenarios of the 1993 metals risk assessment. The risk assessment attempts to consider the “worst-case” ways that people might contact PFOA and PFOS based on biosolids management options, and hence focuses on agricultural scenarios that transfer PFAS through food-chain pathways. The matrix of scenarios and pathways evaluated by EPA quantitatively are summarized in the table below.
| Application Scenario | Exposure Media | |||
| Beef, Eggs, Milk, and Poultry | Fruits and Vegetables | Soil, Surface Water & Fish | Groundwater | |
| Crop Farm | * | * | * | |
| Pasture Farm | * | * | * | |
| Land Reclamation | * | * | * | |
| Disposal | * | |||
The Land Reclamation pathways are similar to those of the Pasture Farm, but the scenario involves a higher, one-time application of biosolids compared with repeated yearly applications at agronomic rates. EPA’s PFAS risk assessment is based on a 1 part-per-billion (µg/kg) concentration for PFOA and PFOS. Fate-and-transport models are used to predict PFAS transfer from biosolids to environmental media and locally raised food, followed by exposure and risk assessment. The conceptual exposure model and linkages for the Pasture Farm and Land Reclamation scenarios are reproduced as examples from EPA’s risk assessment report.

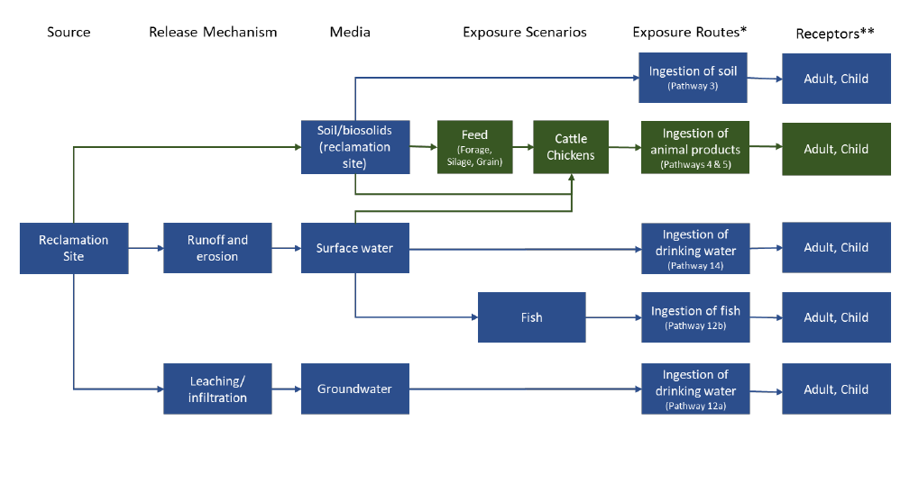
Figure 2 Conceptual exposure model for the Pasture Farm scenario. Source: EPA PFAS Biosolids Risk Assessment
Suffice it to say, EPA’s risk assessment is very complex and involves numerous models and assumptions. The model used to predict PFAS leaching rates from biosolids is a major source of uncertainty, which EPA acknowledges by presenting results for different rates of precipitation infiltration (dry, moderate, and wet climates) and high and low values of the key organic carbon partitioning coefficient (Koc) parameter.
The various scenarios and sensitivity calculations result in a plethora of risk estimates. The following table provides a simplified summary of EPA’s “bottom line” health risk estimates summed across exposure pathways. The numerous red-highlighted values indicate risk estimates that exceed limits typically accepted by regulatory agencies (incremental cancer risks of 100 per million, and non-cancer hazard quotients of 1). The generally higher risk estimates for PFOA in part reflect its greater mobility and tendency to leach out of high organic matter soils (compared with PFOS).
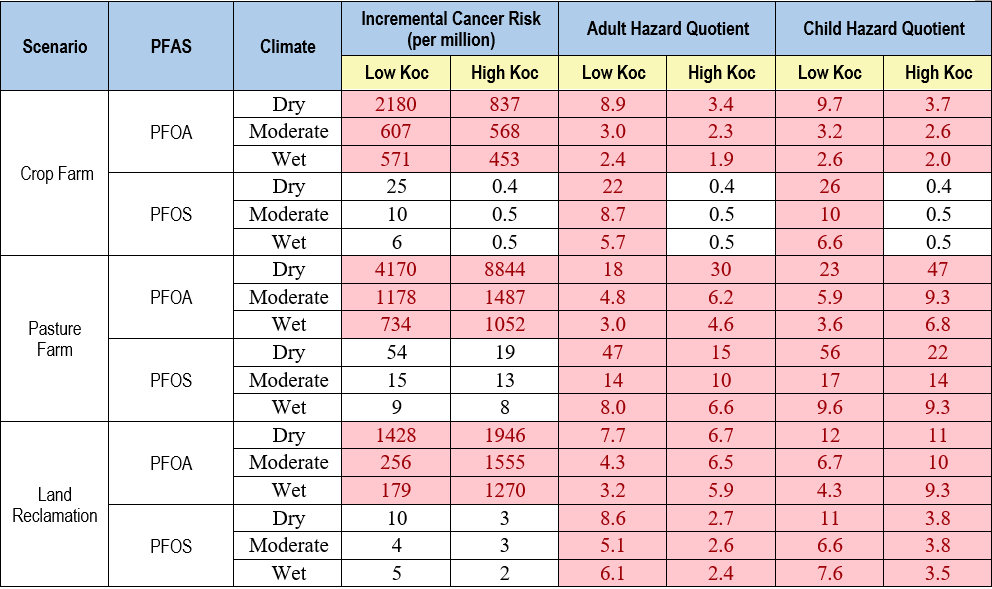
There are likely a number of conservative assumptions embedded within EPA’s risk assessment, though the agency claims to incorporate central tendency values for exposure parameters. Fate and transport models are a possible source of conservatism. The leaching model does not directly include the effects of the air-water interface and other attributes unique to PFAS that influence PFAS retention in soil. Consequently, EPA’s use of a traditional Koc-based model likely overestimates the leaching rates of PFAS to groundwater from soil. However, toxicity values are also an important driver of the elevated risk estimates, especially for PFAS. As discussed in an earlier blog post, PFOA’s cancer potency estimate is the second highest of all chemicals in the November 2024 Regional Screening Level (RSL) tables, and the non-cancer reference doses for PFOA and PFOS rank in the top 10 lowest (most toxic) values.
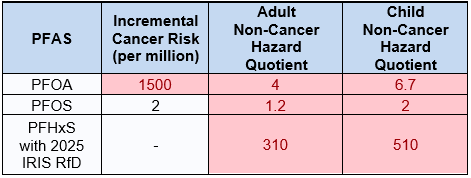
As reported by EPA, biosolids sampling studies typically find more than 1 ppb of PFOS and PFOA. Even if modified in response to comments, EPA’s risk assessment results suggest that land applications of biosolids could in some settings present risks to human health in excess of regulatory limits. The PFAS toxicity values used in EPA’s risk assessment are based on the findings of epidemiological studies that shows correlations between PFAS exposure and reduced antibody response in children. Generalized use of these toxicity values in risk assessments will likely make PFAS risk drivers at many sites. The list of PFAS risk drivers could soon include PFHxS since it has the lowest reference dose in the EPA IRIS database (indicating PFHxS is the most toxic chemical known to EPA for non-cancer health effects). Risk estimates predicted by EPA’s RSL Calculator are provided in the table below for a tap water concentration of 4 parts-per-trillion, adjusting the PFHxS RfD to its January 2025 IRIS value. The red-highlighted values indicate exceedances of limits typically accepted by regulatory agencies (incremental cancer risks of 100 per million, and non-cancer hazard quotients of 1).
The reduced antibody line of evidence is also the basis of the part-per-quadrillion (ppq) values EPA has established for its PFOA and PFOS interim Drinking Water Health Advisories (HAs) and proposed Ambient Water Quality Criteria (AWQCs). At the current ppt reporting levels common among laboratories, the HAs and AWQCs would be exceeded by any detections of PFOA and PFOS in relevant water samples.